Vevo F2 LAZR-X Gallery

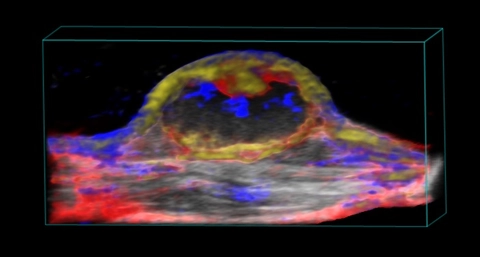
Nanoparticle distribution in tumor
3D rendered high-resolution ultrasound (greyscale) and spectrally unmixed photoacoustic (red, blue and gold) image of a subcutaneous tumor showing nanoparticle distribution (yellow) as well as oxygenated (red) and deoxygenated (blue) hemoglobin signal.
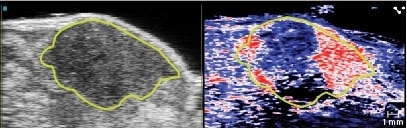
Pancreatic tumor oxygen saturation
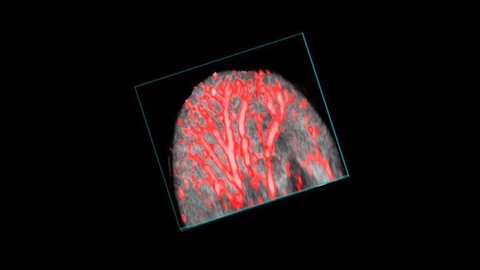
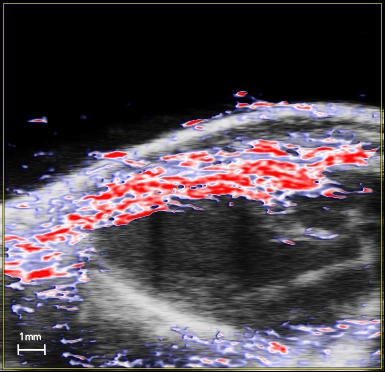
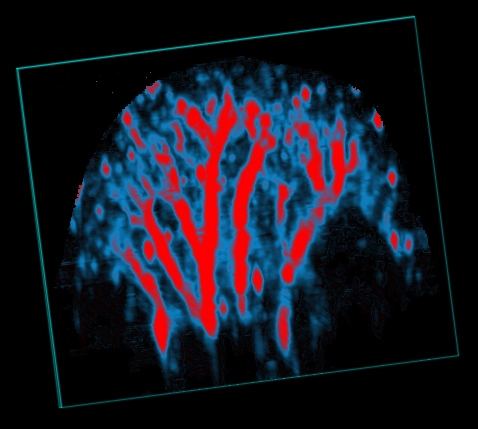
Mouse ear vasculature
3D rendered coregistered ultrasound (greyscale) and photoacoustic (red) image of the mouse ear. The photoacoustic signal is derived from the absorption of light by hemoglobin.

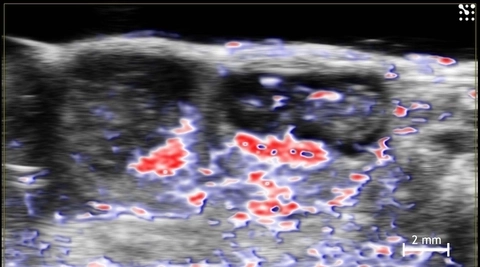
Ischemia/hypoxia stroke model
Co-registered 3D rendered ultrasound (greyscale) and color Doppler (red and blue) coronal image of a mouse brain during ligation of the right common carotid artery. The red and blue color represent blood flow velocity and direction clearly showing impaired blood flow in the right hemisphere.
Blood signal in mouse brain
3D rendered photoacoustic image showing cerebral blood signal in the mouse brain.
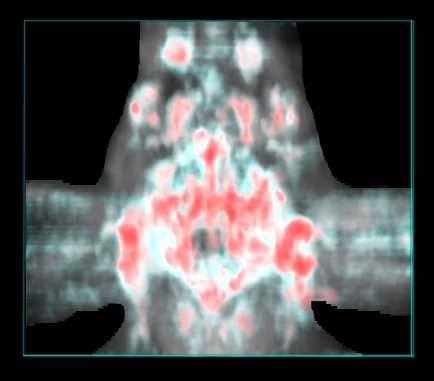
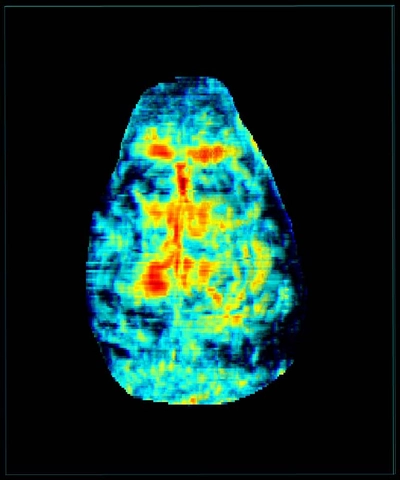
Oxygen saturation map in the mouse brain
3D rendered co-registered ultrasound (greyscale) and photoacoustic (red, white and teal) image showing a parametric map of oxygen saturation with red signals indicating higher sO2 values.
Oxygen saturation in the myocardium
High-resolution ultrasound (greyscale) and photoacoustic (red, white and blue) image of a long axis view of the left ventricle of the mouse heart. The photoacoustic image is a parametric map of oxygen saturation in the myocardium.
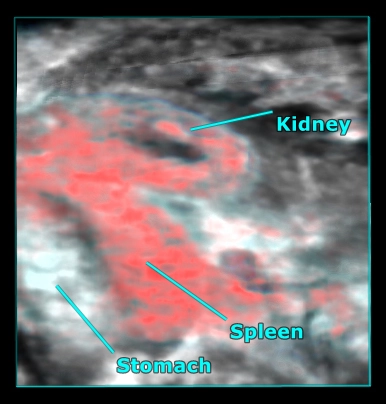
Mouse abdominal organs
3D rendered high-resolution ultrasound (greyscale) and photoacoustic (red) image of the mouse abdomen showing oxygen saturation in the kidney and spleen.
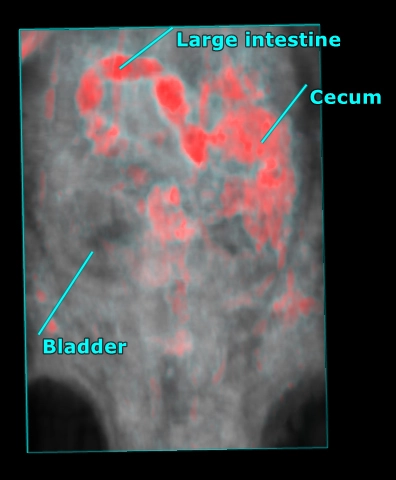
Mouse abdomen
3D rendered high-resolution ultrasound (grey) and photoacoustic (red) image of the whole mouse abdomen showing highly absorbing gut contents overlaid with anatomy as visualized with ultrasound.
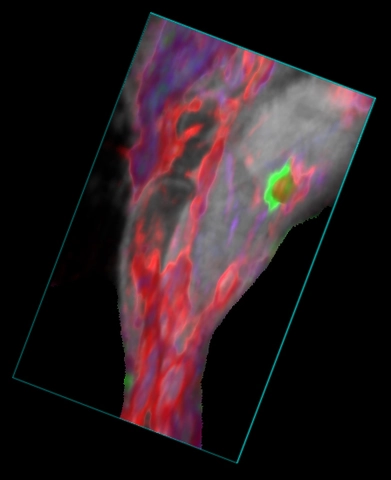
Mouse hindlimb showing blood and ICG
3D rendered high-resolution ultrasound (greyscale) and spectrally unmixed photoacoustic (red, blue and green) image of the mouse hindlbimb. The green color indicates ICG dye in the popliteal lymph node after a hindpaw injection, the red color indicated oxygenated hemoglobin and the blue color indicates deoxygenated hemoglobin.
Mouse ear vasculature
3D rendering of a photoacoustic parametric map of oxygen saturation in the mouse ear. Red pixels indicate higher sO2 values.
Oxygen Saturation in the Mouse Placenta and Fetus
Oxy-hemo phototacoustics image showing oxygen saturation in two mid-gestational mouse implantation sites. Red indicates oxygenated hemoglobin; blue indicates de-oxygenated hemoglobin.