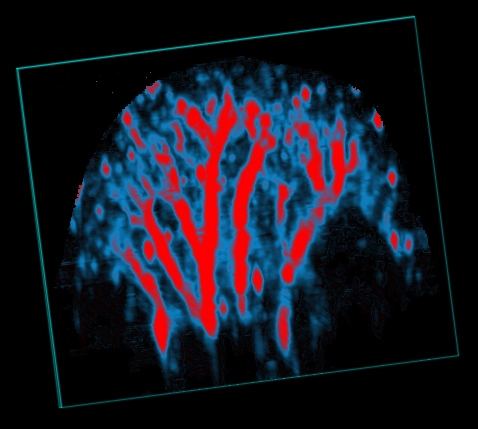
3D rendering of a photoacoustic parametric map of oxygen saturation in the mouse ear. Red pixels indicate higher sO2 values.
3D rendering of a photoacoustic parametric map of oxygen saturation in the mouse ear. Red pixels indicate higher sO2 values.