Ephelis
Ephelis
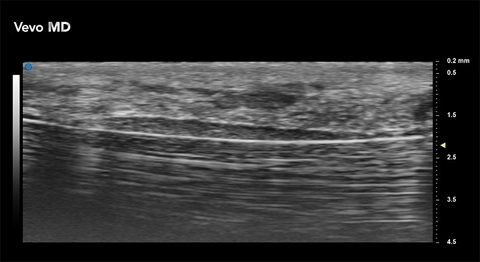
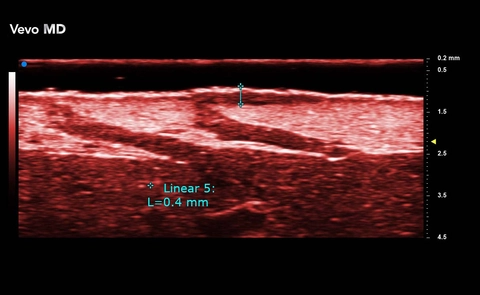
A1 Pulley
A1 Pulley

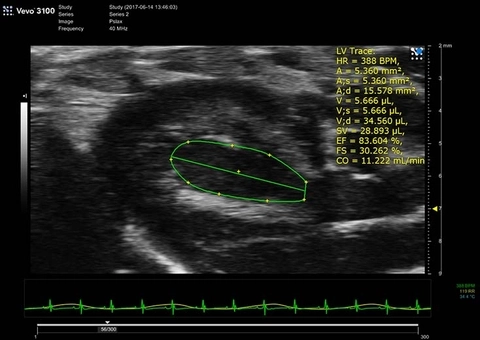
LV Trace of Parasternal Long Axis
B-Mode image of mouse heart in full systole.
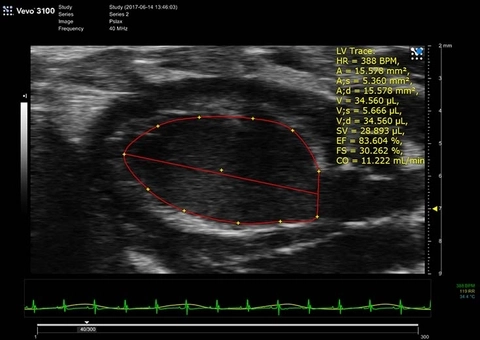
PSLAX LV Trace B-Mode Diastole
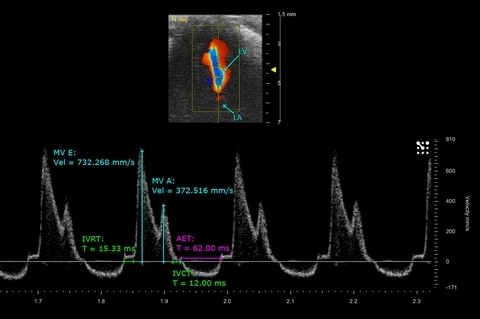
Mitral flow and measurements of a mouse neonate heart
PW Doppler of mitral blood flow in a postnatal day 9 mouse taken from an apical 4 chamber view, with related cardio measurements.
Oxygen saturation in tumor
Perfusion in Tumor
3D rendered high-resolution ultrasound (greyscale) and nonlinear contrast (beige) image of a subcutaneous tumor showing perfusion in the tumor tissue.
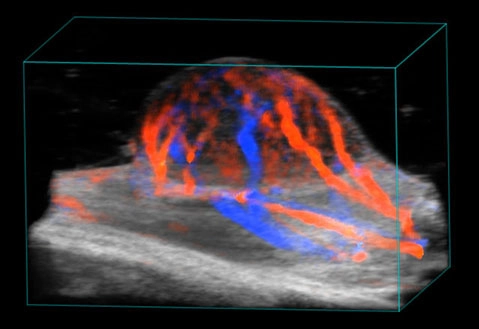
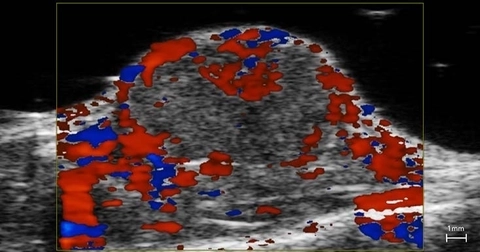
Blood flow in tumor
3D rendered high-resolution ultrasound (greyscale) and color Doppler (orange and blue) image of a subcutaneous tumor showing blood flow.
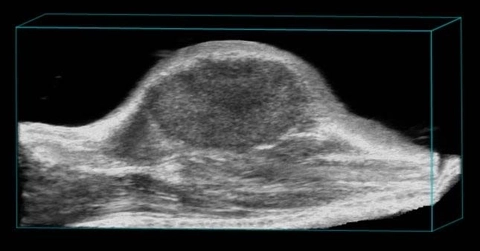
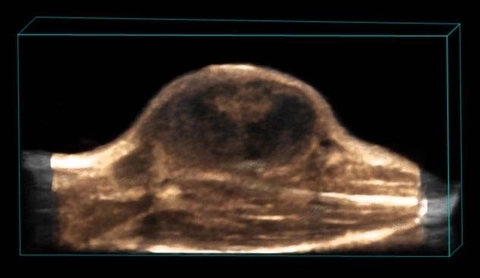
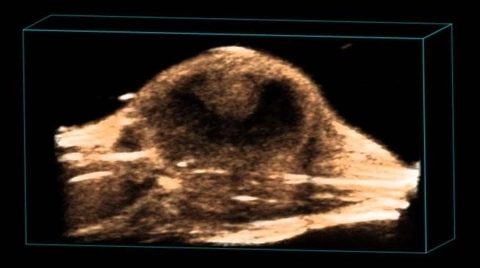
Subcutaneous tumor
3D rendered high-resolution ultrasound image of a subcutaneous tumor.
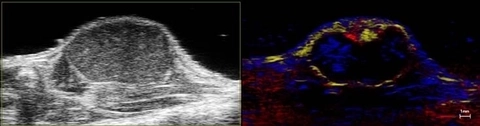
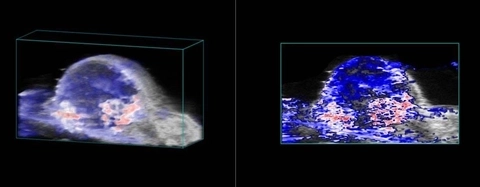
Nanoparticle distribution in tumor
High-resolution ultrasound (left) and spectrally unmixed photoacoustic (right) image of a subcutaneous tumor showing nanoparticle distribution (yellow) as well as oxygenated (red) and deoxygenated (blue) hemoglobin signal.
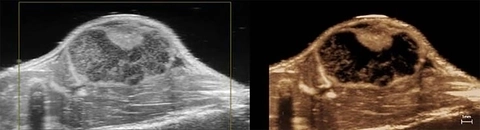
Perfusion in Tumor
High-resolution ultrasound (left) and nonlinear contrast (right) image of a subcutaneous tumor showing perfusion in the tumor tissue.
Blood flow in tumor
Perfusion in Tumor
3D rendered high-resolution nonlinear contrast image of a subcutaneous tumor showing perfusion in the tumor tissue.
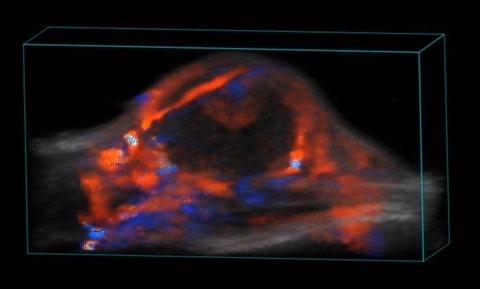
Blood flow in tumor
3D rendered high-resolution ultrasound (greyscale) and color Doppler (orange and blue) image of a subcutaneous tumor showing blood flow.
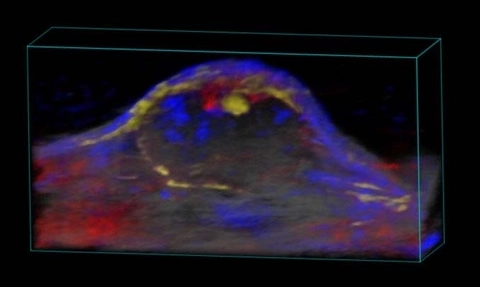
Nanoparticle distribution in tumor
3D rendered high-resolution ultrasound (greyscale) and spectrally unmixed photoacoustic (red, blue and gold) image of a subcutaneous tumor showing nanoparticle distribution (yellow) as well as oxygenated (red) and deoxygenated (blue) hemoglobin signal.