Ischemia / Reperfusion Gallery

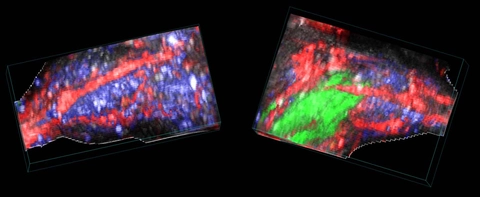
Stem cells in the mouse hindlimb
3D rendered spectrally unmixed photoacoustic image of a stem-cell injected, ischemic (right) and control (left) mouse hindlimb. Oxyhemoglobin (red), deoxyhemoglobin (blue) and dye-labelled stem cells (green) are shown.
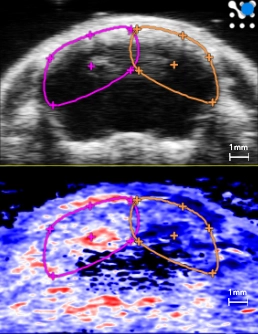
Ischemia/hypoxia stroke model
Plot of oxygen saturation (sO2) over time in the left (pink) and right (orange) cortical and subcortical hemisphere ROIs while restoring breathed oxygen to 100% from 7.5% post ischemia/hypoxia for stroke induction. Ultrasound (top) and photoacoustic (bottom) coronal images in the right panel show a frame of mouse brain post ischemia/hypoxia. The red, white and blue color represents a parametric map of oxygen saturation. The right hemisphere does not fully recover sO2 levels post-reperfusion/normoxia that are shown in the left hemisphere, indicating a cerebral infarct, especially in cortical and subcortical areas.
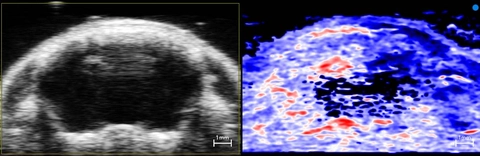
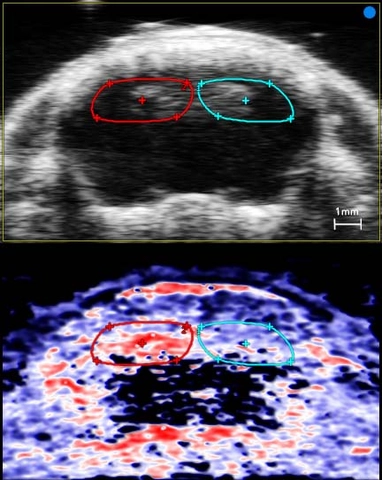
Ischemia/hypoxia stroke model
Ultrasound (left) and photoacoustic (right) coronal images of a mouse brain post ischemia/hypoxia. The red, white and blue color represents a parametric map of oxygen saturation. The right hemisphere does not fully recover sO2 levels post-reperfusion/normoxia that are shown in the left hemisphere, indicating a cerebral infarct, especially in cortical and subcortical areas.
Mouse hindlimb post-reperfusion
3D rendered power Doppler image of the mouse hindlimb showing blood flow. Application of a tourniquet made of tubing was used to restrict blood flow into the distal part of the limb, then relieved to allow reperfusion.
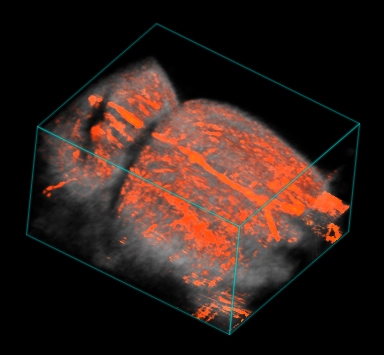
Mouse hindlimb post-reperfusion
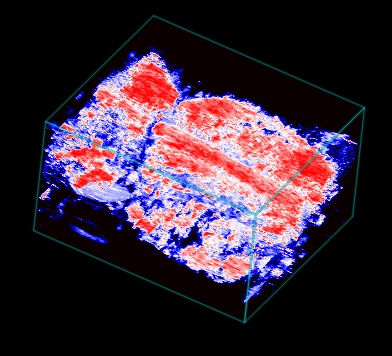
3D rendered photoacoustic image of the mouse hindlimb showing a parametric map of oxygen saturation with red denoting higher sO2 values. Application of a tourniquet made of tubing was used to restrict blood flow into the distal part of the limb, then relieved to allow reperfusion. Higher sO2 is seen in the distal part of the limb post-reperfusion.
Mouse hindlimb during ischemia
3D rendered photoacoustic image of the mouse hindlimb showing a parametric map of oxygen saturation with red denoting higher sO2 values. Application of a tourniquet made of tubing was used to restrict blood flow into the distal part of the limb. Much lower sO2 is seen in the distal part of the limb during this acute ischemia.
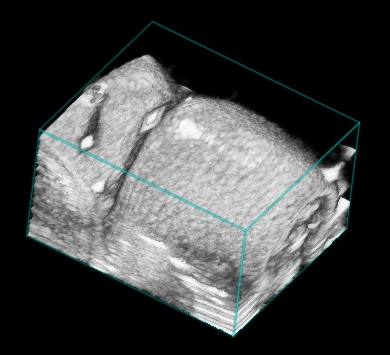
Mouse hindlimb with tourniquet
3D rendered high-resolution ultrasound image of the mouse hindlimb showing a depression in the skin from a tourniquet made of tubing being used to restrict blood flow into the distal part of the limb.
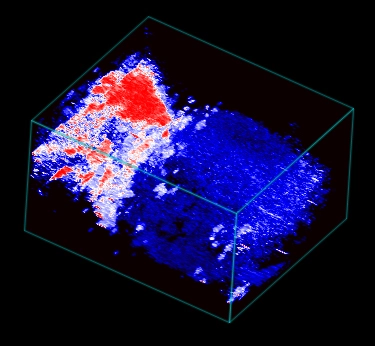
Ischemia/hypoxia stroke model
3D rendered coronal ultrasound (greyscale) and photoacoustic (red) images of a mouse brain during ligation of the right common carotid artery. The red color represents higher oxygen saturation clearly showing lower sO2 in the right hemisphere.

Ischemia/hypoxia stroke model
Co-registered 3D rendered ultrasound (greyscale) and color Doppler (red and blue) coronal image of a mouse brain during ligation of the right common carotid artery. The red and blue color represent blood flow velocity and direction clearly showing impaired blood flow in the right hemisphere.
Ischemia/hypoxia stroke model
Ultrasound (top) and photoacoustic (bottom) coronal images of a mouse brain during ligation of the right common carotid artery. The red, white and blue color represents a parametric map of oxygen saturation clearly showing lower sO2 in the right hemisphere.
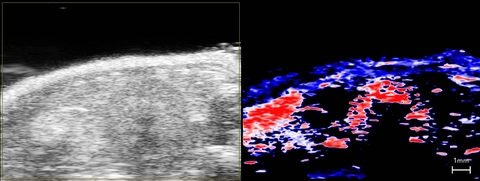
Oxygen Saturation in the Kidney
Oxy-hemo Mode in the mouse kidney looking at oxygen saturation. Red indicates areas of high oxygen saturation; blue indicates areas of low oxygen saturation.
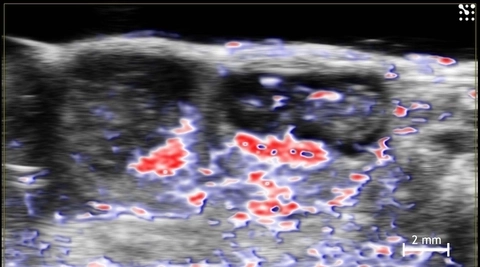
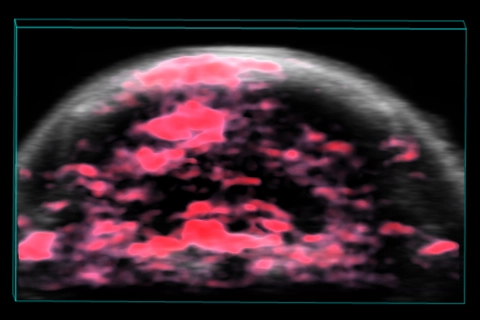
Oxygen Saturation in the Mouse Placenta and Fetus
Oxy-hemo phototacoustics image showing oxygen saturation in two mid-gestational mouse implantation sites. Red indicates oxygenated hemoglobin; blue indicates de-oxygenated hemoglobin.