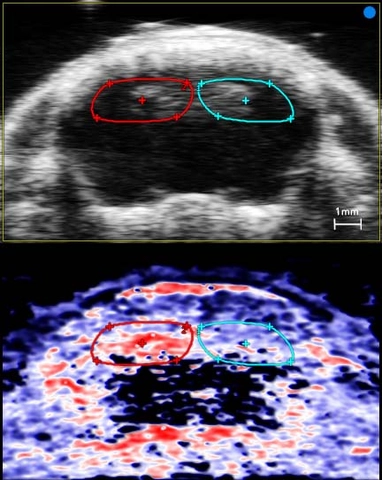
Ultrasound (top) and photoacoustic (bottom) coronal images of a mouse brain during ligation of the right common carotid artery. The red, white and blue color represents a parametric map of oxygen saturation clearly showing lower sO2 in the right hemisphere.