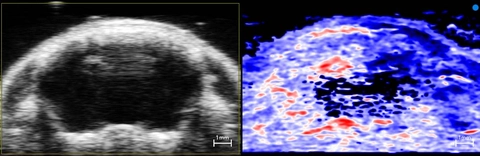
Ultrasound (left) and photoacoustic (right) coronal images of a mouse brain post ischemia/hypoxia. The red, white and blue color represents a parametric map of oxygen saturation. The right hemisphere does not fully recover sO2 levels post-reperfusion/normoxia that are shown in the left hemisphere, indicating a cerebral infarct, especially in cortical and subcortical areas.