Vevo Multiplexer
Hearing in Color: Visualizing multiple biomarkers with spectral unmixing

Spectral unmixing
Many molecules have unique optical absorption characteristics that act as “spectral fingerprints”.
Using multispectral photoacoustic data, a technique called spectral unmxing can be performed in order to identify and distinguish these components from each other.
Using Multi-wavelength or Spectro data from the system, researchers can use Vevo Multiplexer to unmix and visualize up to 5 different compounds simultaneously while locating these signals within high-resolution B-Mode anatomy. In addition, 2D and 3D quantification of these signals can be performed including relative photoacoustic signal intensity, oxygen saturation and total hemoglobin.
Live Unmixing feature which allows one spectrally unmixed component to be displayed live during multispectral imaging. Includes oxygen saturation and total hemoglobin measurements for non-OxyHemo multi-wavelength datasets. (Available with version 3.2.5)
Examples of compounds that can be unmixed and multiplexed include:
- Oxy-and deoxyhemoglobin
- Optical dyes
- Nanoparticles
- Melanin
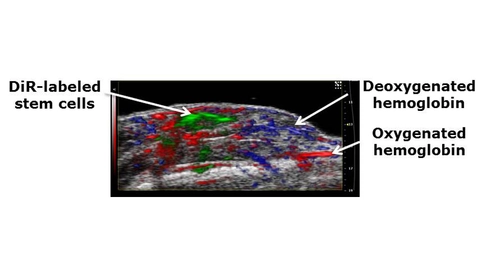
Spectrally Unmixed Image
Spectrally unmixed image of DiR-labeled stem cells (green), oxyhemoglobin (red) and deoxyhemoglobin (blue) coregistered with a B-Mode image of the mouse hindlimb. Cells were incubated with DiR and injected into a femoral artery ligated ischemic hind limb model. (Images courtesy of Dr. Young-sup Yoon, Director of Stem Cell Biology, Professor of Medicine, Emory University)

Spectral Fingerprints
“Spectral fingerprints” from various compounds acquired using Spectro Mode can be saved into the software and used with our spectral unmixing algorithm to delineate and quantify oxygenated and deoxygenated blood and various contrast agents.
Request a Quote or Software Trial