Developmental Gallery

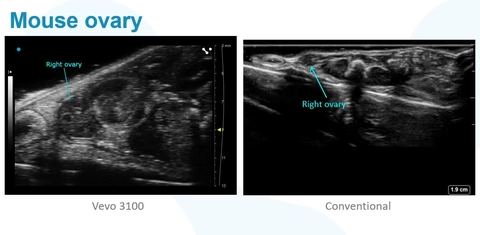
Mouse Ovary - Vevo 3100 vs. Conventional
Mouse ovary acquired using ultra high frequency ultrasound (Vevo 3100) against an image of the same mouse ovary using a conventional ultrasound system.
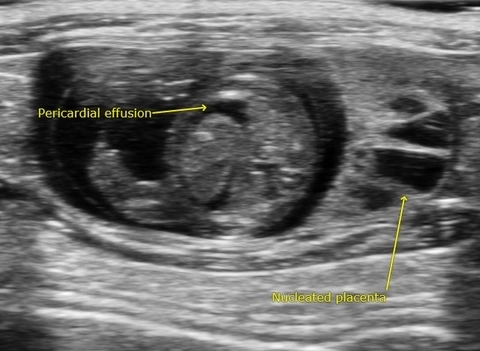
Pericardial Effusion - Spina Bifida Rat Model
Spina bifida is a neural tube defect that results in incomplete closing of the spinal cord. Spina bifida is associated with abnormalities in the cerebellum and cisterna magna during fetal development. This image acquired using the Vevo 3100.
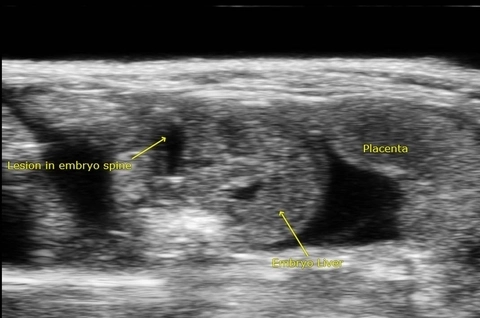
Lesion in Embryo Spine - Spina Bifida Rat Model
Spina bifida is a neural tube defect that results in incomplete closing of the spinal cord. Spina bifida is associated with abnormalities in the cerebellum and cisterna magna during fetal development. This image acquired using the Vevo 3100.
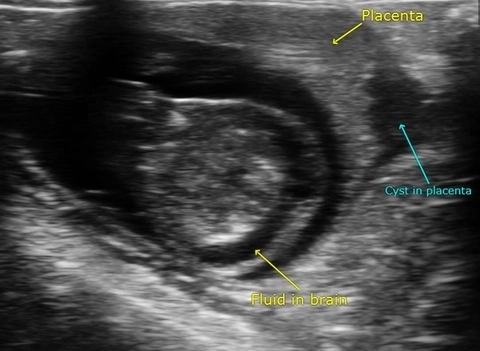
Fluid in Brain - Spina Bifida Rat Model
Spina bifida is a neural tube defect that results in incomplete closing of the spinal cord. Spina bifida is associated with abnormalities in the cerebellum and cisterna magna during fetal development. This image acquired using the Vevo 3100.
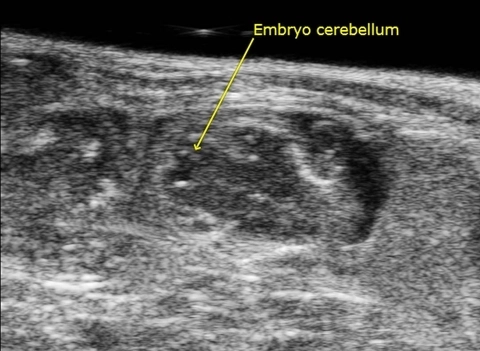
Embryo Cerebellum - Spina Bifida Rat Model
Spina bifida is a neural tube defect that results in incomplete closing of the spinal cord. Spina bifida is associated with abnormalities in the cerebellum and cisterna magna during fetal development. This image acquired using the Vevo 3100.
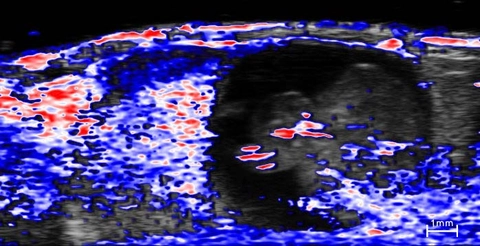
Oxygen saturation in E14 mouse embryo and placenta
In vivo co-registered high-resolution ultrasound (greyscale) and photoacoustic (red, white and blue) image of an E14 embryo and its associated placenta (on left of each image). The photoacoustic signal represents a parametric map of oxygen saturation with red values representing higher sO2. The image was acquired while the mother was breathing medical air (20% O2). Oxygen saturation can be distinguished within differing placental and embryonic anatomy.
Oxygen saturation in E14 mouse embryo and placenta
In vivo 3D rendered co-registered high-resolution ultrasound (greyscale) and photoacoustic (red, white and blue) image of an E14 embryo and its associated placenta (on left). The photoacoustic signal represents a parametric map of oxygen saturation with red values representing higher sO2. The image was acquired while the mother was breathing medical air (20% O2).

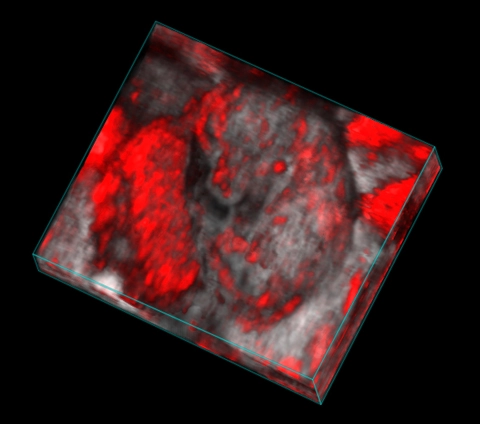
Oxygen saturation in E14 mouse embryo and placenta
In vivo 3D rendered co-registered high-resolution ultrasound (greyscale) and photoacoustic (red, white and blue) image of an E14 embryo and its associated placenta (on left). The photoacoustic signal represents a parametric map of oxygen saturation with red values representing higher sO2. The image was acquired while the mother was breathing 100% oxygen.
E14 mouse embryo
In vivo 3D rendered co-registered high-resolution ultrasound (greyscale) and photoacoustic (red) image of an E14 embryo and its associated placenta (on left). The photoacoustic signal was acquired at 750nm and represents signal from mostly deoxygenated hemoglobin.
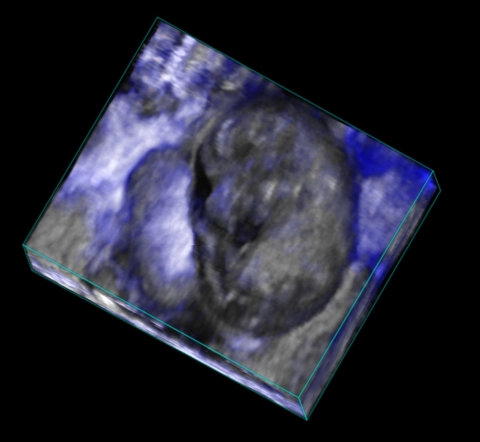
E14 mouse embryo
In vivo 3D rendered high-resolution ultrasound image of an E14 embryo and its associated placenta (on left).
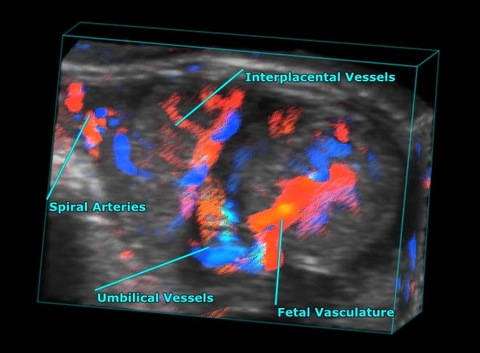
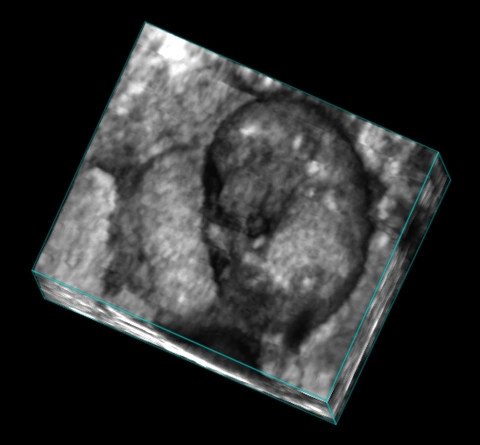
Mid-gestational Mouse Fetus and Placenta
3D color Doppler rendering of a mid-gestational mouse fetus and placenta, highlighted placental and fetal vasculature.
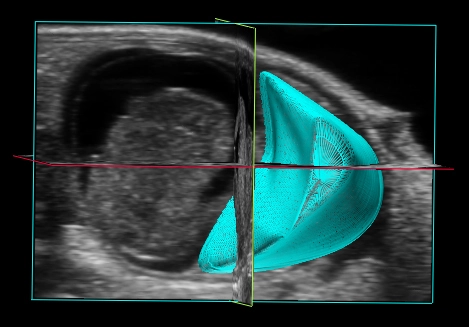
3D Reconstruction of the Placenta
3D reconstruction of the mid-gestational mouse placenta (in blue) with fetus to the left of the image.
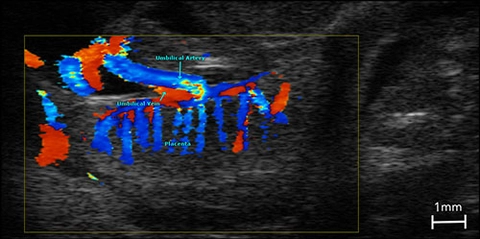
Placental Blood Flow
Color Doppler image illustrating blood flow in the fetus, umbilical cord and placenta in a late gestational mouse implantation site.