Oncology Gallery
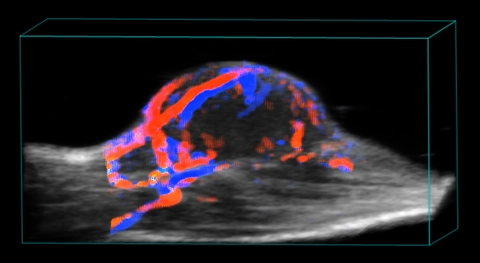
Blood flow in tumor
3D rendered high-resolution ultrasound (greyscale) and color Doppler (orange and blue) image of a subcutaneous tumor showing blood flow.
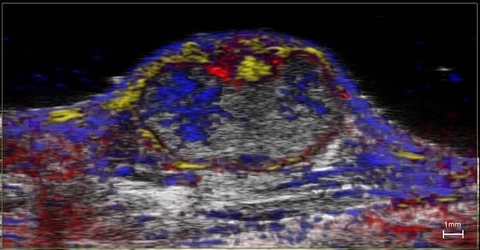
Nanoparticle distribution in tumor
High-resolution ultrasound (greyscale) and spectrally unmixed photoacoustic (color) image of a subcutaneous tumor showing nanoparticle distribution (yellow) as well as oxygenated (red) and deoxygenated (blue) hemoglobin signal.
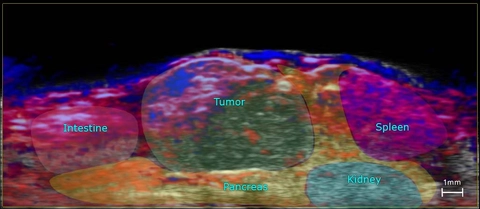
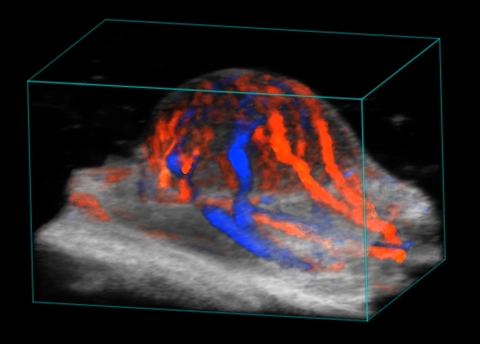
Orthotopic Pancreatic Tumor
High-resolution ultrasound (greyscale) and photoacoustic (red = oxygenated hemoglobin and blue = deoxyhemoglobin) image of an orthotopic pancreatic tumor outlining anatomy.
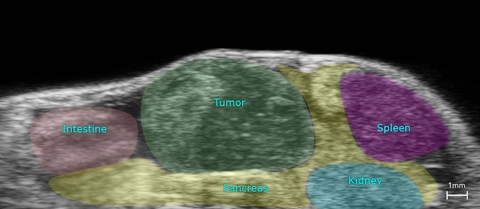
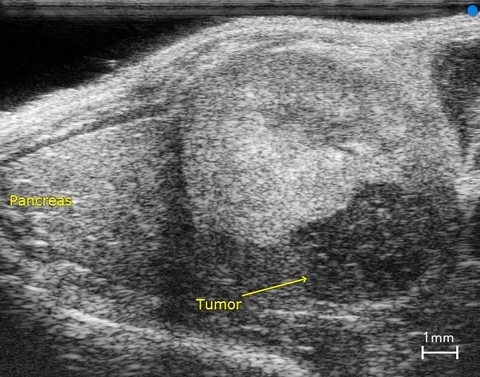
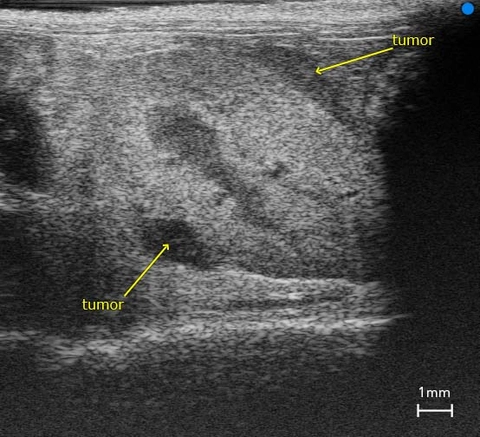
Orthotopic Pancreatic Tumor
High-resolution ultrasound image of an orthotopic pancreatic tumor outlining anatomy.
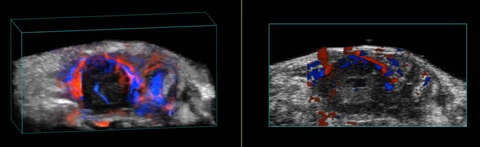
Blood flow in orthotopic tumor
3D rendered (left) and 2D (right) high-resolution ultrasound (greyscale) and color Doppler (orange and blue) image of an orthotopic pancreatic tumor showing blood flow.
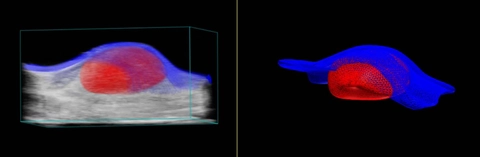
Tumor and Skin Segmentation
3D rendered high-resolution ultrasound image showing wireframe segmentation of a tumor (red) and the overlying skin (blue).
Blood flow in tumor
3D rendered high-resolution ultrasound (greyscale) and color Doppler (orange and blue) image of a subcutaneous tumor showing blood flow.

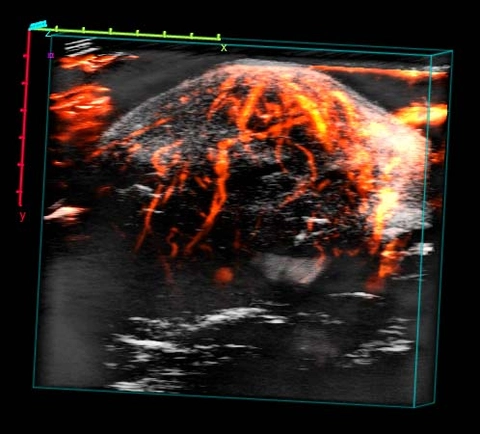
Subcutaneous Tumor
3D power Doppler of a subcutaneous tumor in a mouse.
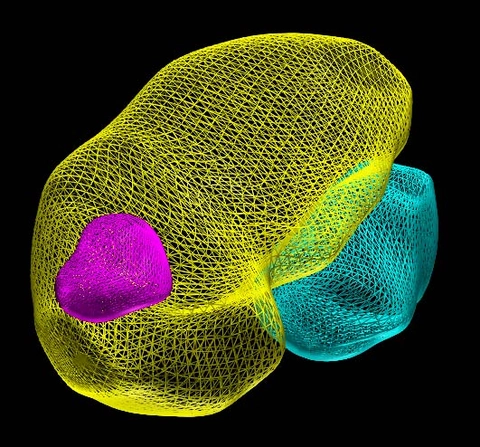
3D Volume of the Left Kidney with Tumors
3D volumes drawn around the murine left kidney (in yellow) and associated tumors (in pink and blue).
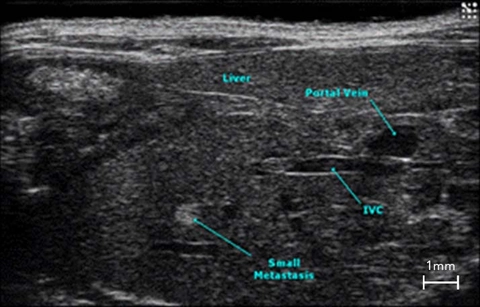
Liver Metastasis
Cross section of the mouse abdomen highlighting major structures, including liver metastasis.
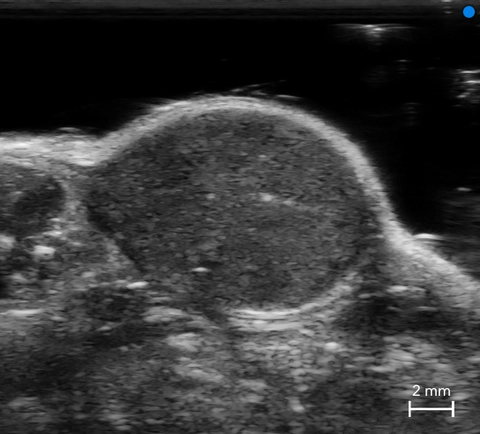
Subcutaneous Tumor
B-Mode image of a subcutaneous tumor in a mouse.
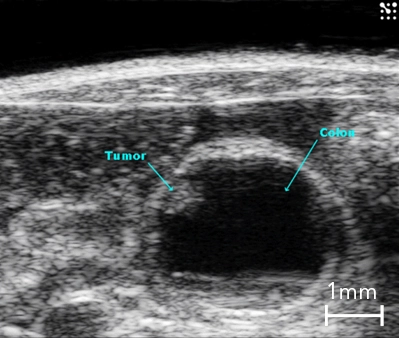
Colon Cancer
B-Mode image of the mouse colon in cross-section with presence of a tumor highlighted.
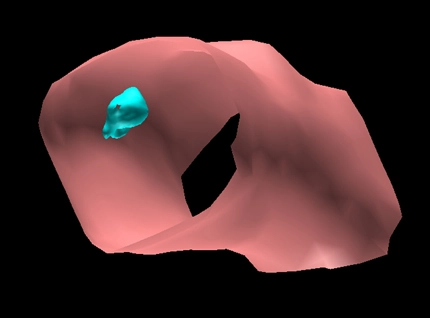
3D Surface Volume of the Mouse Colon with Tumor
Surface view of a 3D volume of a section of mouse colon (in pink) with a tumor (in blue).
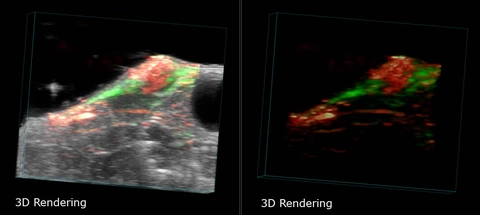
Breast Cancer Tumor in 3D
Breast Cancer Tumor in a mouse, imaged with photoacoustics in 3D. Shows localization of a targeted nanoparticle (green) within the tumor. Left panel shows both photoacoustics and ultrasound images, overlaid. Right panel shows only the photoacoustics signal.
Left Kidney in the Mouse with Subcapsular Tumor
The left kidney with subcapsular tumor and pancreas of a mouse, imaged in B-Mode.
Kidney with Subcapsular Tumor
Kidney with Subcapsular Tumor.