Theranostics Gallery

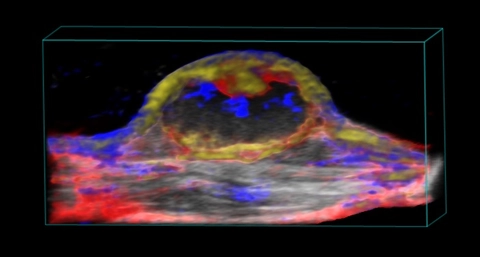
Nanoparticle distribution in tumor

3D rendered high-resolution ultrasound (greyscale) and spectrally unmixed photoacoustic (red, blue and gold) image of a subcutaneous tumor showing nanoparticle distribution (yellow) as well as oxygenated (red) and deoxygenated (blue) hemoglobin signal.

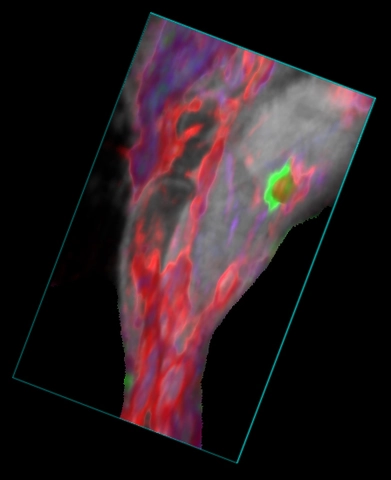
Mouse hindlimb showing blood and ICG

3D rendered high-resolution ultrasound (greyscale) and spectrally unmixed photoacoustic (red, blue and green) image of the mouse hindlbimb. The green color indicates ICG dye in the popliteal lymph node after a hindpaw injection, the red color indicated oxygenated hemoglobin and the blue color indicates deoxygenated hemoglobin.