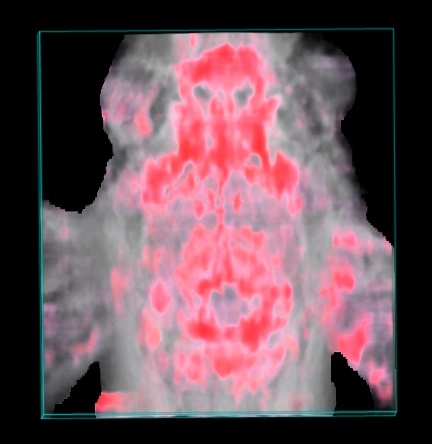
3D rendered co-registered ultrasound (greyscale) and photoacoustic (red and white) image showing a parametric map of oxygen saturation with red signals indicating higher sO2 values.
3D rendered co-registered ultrasound (greyscale) and photoacoustic (red and white) image showing a parametric map of oxygen saturation with red signals indicating higher sO2 values.