Kidney Gallery
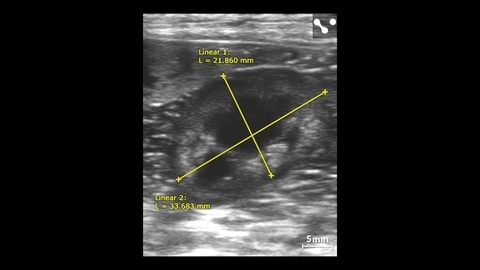
Canine Left Kidney with Measurements

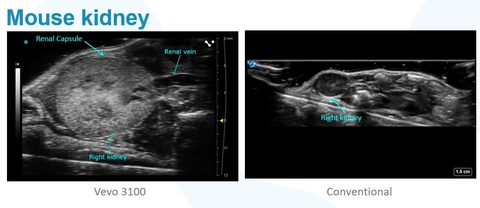
Mouse Kidney - Vevo 3100 vs Conventional
What you see using the Vevo 3100 compared with what you can see using a conventional ultrasound system is shown here. See the mouse kidney in great detail using ultra high frequency ultrasound imaging.
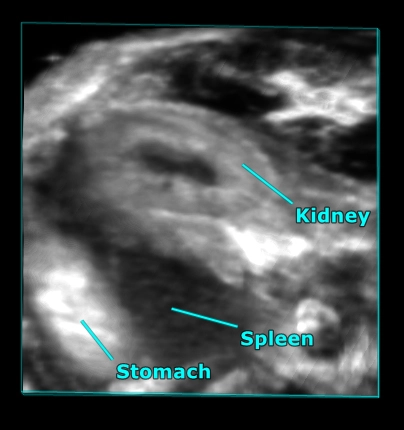
Mouse abdominal organs
3D rendered high-resolution ultrasound image of the mouse abdomen showing the kidney, stomach and spleen.
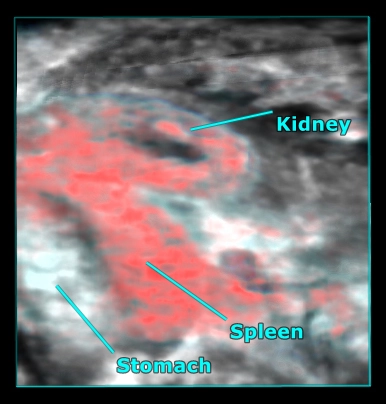
Mouse abdominal organs
3D rendered high-resolution ultrasound (greyscale) and photoacoustic (red) image of the mouse abdomen showing oxygen saturation in the kidney and spleen.
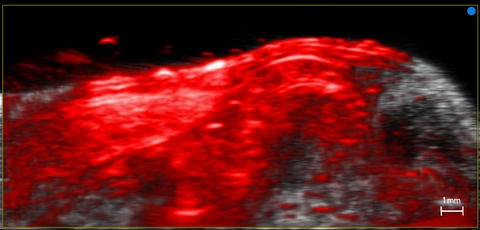
Mouse abdomen showing kidney and spleen
High-resolution ultrasound (greyscale) and photoacoustic (red and white) cross-sectional image of the mouse abdomen showing vasculature in the kidney and spleen.
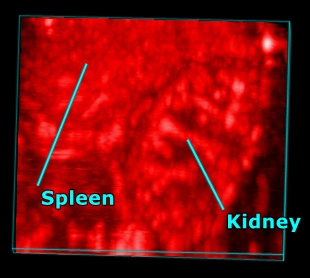
Photoacoustic image of mouse spleen and kidney
3D rendered photoacoustic image of the mouse kidney and spleen.
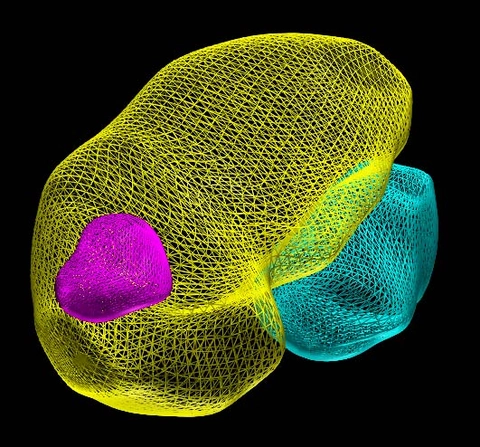
3D Volume of the Left Kidney with Tumors
3D volumes drawn around the murine left kidney (in yellow) and associated tumors (in pink and blue).
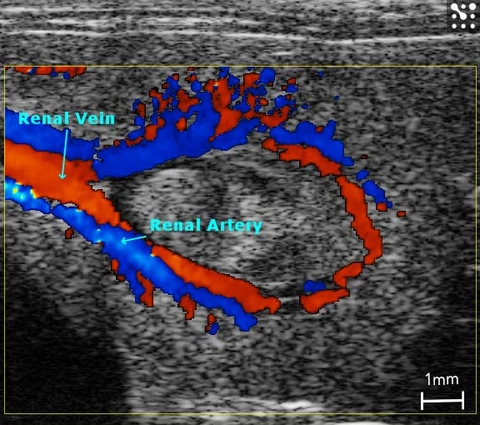
Renal Vasculature in the Rat
Blood flow into the rat kidney imaged with color Doppler.
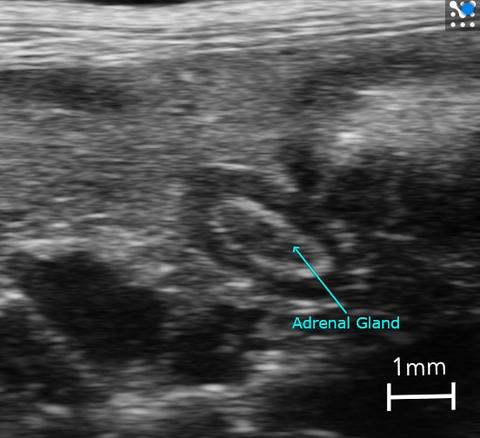
Mouse Adrenal Gland
The adrenal gland in a mouse imaged with B-Mode.
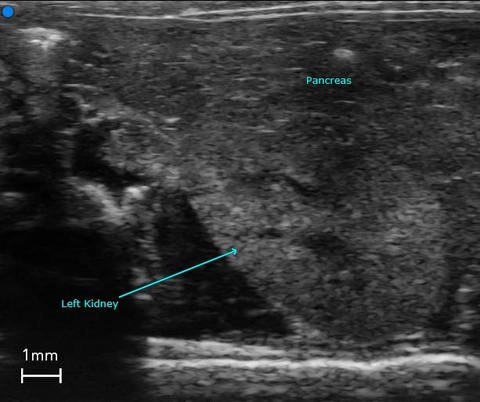
Left Kidney in the Mouse
B-Mode image of the left kidney in the mouse.
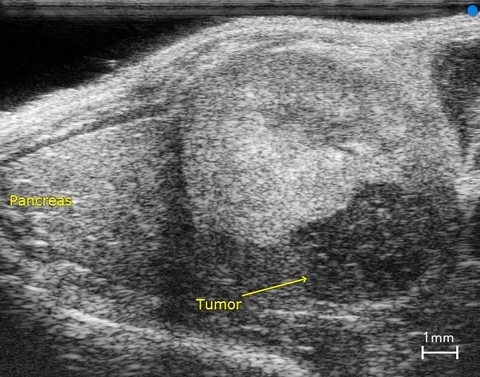
Left Kidney in the Mouse with Subcapsular Tumor
The left kidney with subcapsular tumor and pancreas of a mouse, imaged in B-Mode.
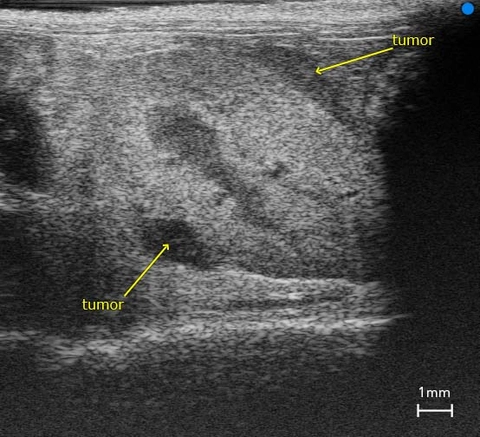
Kidney with Subcapsular Tumor
Kidney with Subcapsular Tumor.
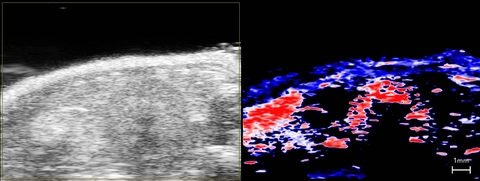
Oxygen Saturation in the Kidney
Oxy-hemo Mode in the mouse kidney looking at oxygen saturation. Red indicates areas of high oxygen saturation; blue indicates areas of low oxygen saturation.