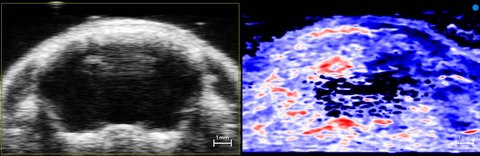
Ischemia/hypoxia stroke model
Ultrasound (left) and photoacoustic (right) coronal images of a mouse brain post ischemia/hypoxia. The red, white and blue color represents a parametric map of oxygen saturation. The right hemisphere does not fully recover sO2 levels post-reperfusion/normoxia that are shown in the left hemisphere, indicating a cerebral infarct, especially in cortical and subcortical areas.
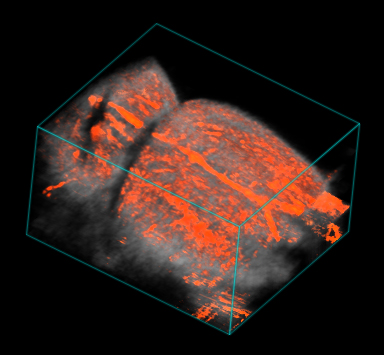
Mouse hindlimb post-reperfusion
3D rendered power Doppler image of the mouse hindlimb showing blood flow. Application of a tourniquet made of tubing was used to restrict blood flow into the distal part of the limb, then relieved to allow reperfusion.
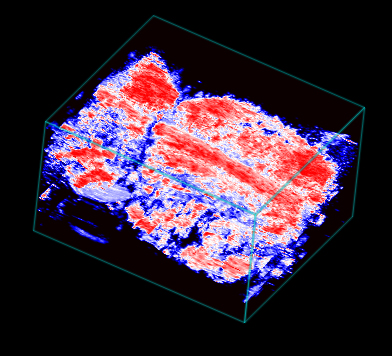
Mouse hindlimb post-reperfusion
3D rendered photoacoustic image of the mouse hindlimb showing a parametric map of oxygen saturation with red denoting higher sO2 values. Application of a tourniquet made of tubing was used to restrict blood flow into the distal part of the limb, then relieved to allow reperfusion. Higher sO2 is seen in the distal part of the limb post-reperfusion.
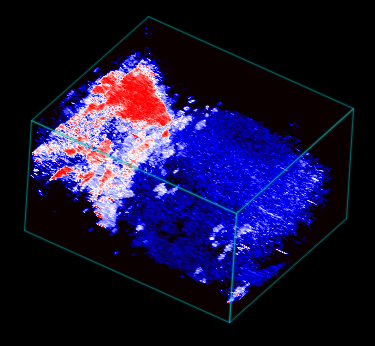
Mouse hindlimb during ischemia
3D rendered photoacoustic image of the mouse hindlimb showing a parametric map of oxygen saturation with red denoting higher sO2 values. Application of a tourniquet made of tubing was used to restrict blood flow into the distal part of the limb. Much lower sO2 is seen in the distal part of the limb during this acute ischemia.
Mouse hindlimb with tourniquet
3D rendered high-resolution ultrasound image of the mouse hindlimb showing a depression in the skin from a tourniquet made of tubing being used to restrict blood flow into the distal part of the limb.
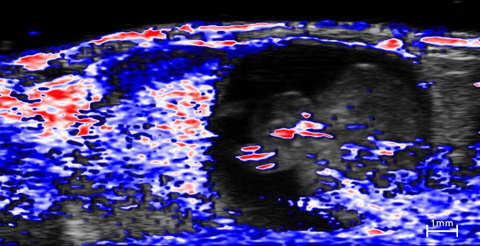
Oxygen saturation in E14 mouse embryo and placenta
In vivo co-registered high-resolution ultrasound (greyscale) and photoacoustic (red, white and blue) image of an E14 embryo and its associated placenta (on left of each image). The photoacoustic signal represents a parametric map of oxygen saturation with red values representing higher sO2. The image was acquired while the mother was breathing medical air (20% O2). Oxygen saturation can be distinguished within differing placental and embryonic anatomy.
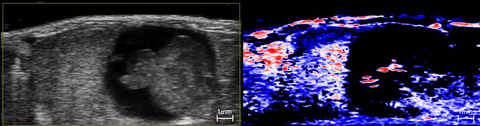
Oxygen saturation in E14 mouse embryo and placenta
In vivo high-resolution ultrasound (left) and photoacoustic (right) image of an E14 embryo and its associated placenta (on left of each image). The photoacoustic signal represents a parametric map of oxygen saturation with red values representing higher sO2. The image was acquired while the mother was breathing medical air (20% O2). Placental and embryonic anatomy can be distinguished.
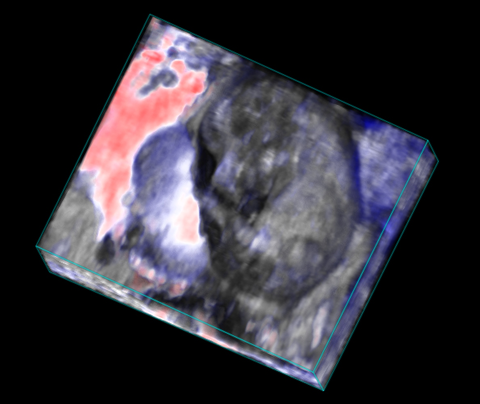
Oxygen saturation in E14 mouse embryo and placenta
In vivo 3D rendered co-registered high-resolution ultrasound (greyscale) and photoacoustic (red, white and blue) image of an E14 embryo and its associated placenta (on left). The photoacoustic signal represents a parametric map of oxygen saturation with red values representing higher sO2. The image was acquired while the mother was breathing medical air (20% O2).
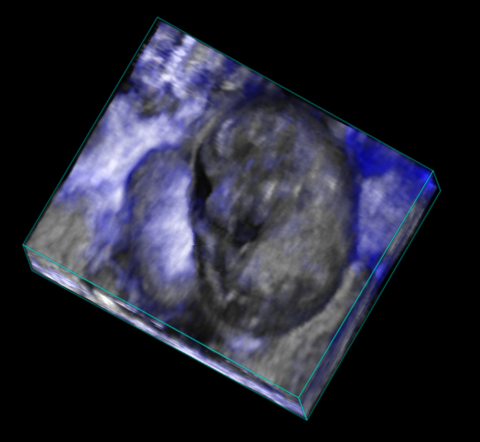
Oxygen saturation in E14 mouse embryo and placenta
In vivo 3D rendered co-registered high-resolution ultrasound (greyscale) and photoacoustic (red, white and blue) image of an E14 embryo and its associated placenta (on left). The photoacoustic signal represents a parametric map of oxygen saturation with red values representing higher sO2. The image was acquired while the mother was breathing 100% oxygen.
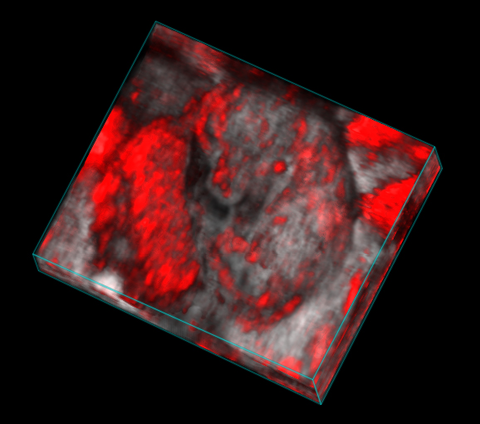
E14 mouse embryo
In vivo 3D rendered co-registered high-resolution ultrasound (greyscale) and photoacoustic (red) image of an E14 embryo and its associated placenta (on left). The photoacoustic signal was acquired at 750nm and represents signal from mostly deoxygenated hemoglobin.
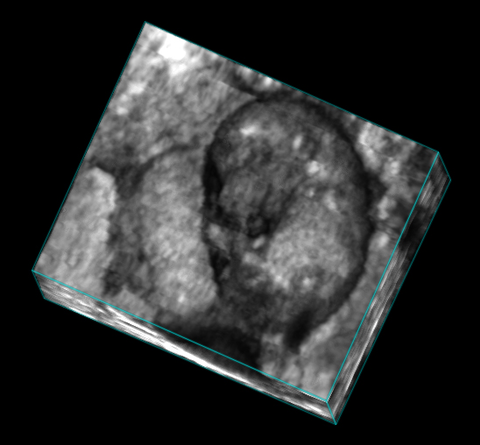
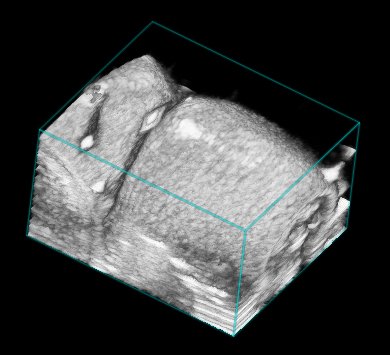
E14 mouse embryo
In vivo 3D rendered high-resolution ultrasound image of an E14 embryo and its associated placenta (on left).

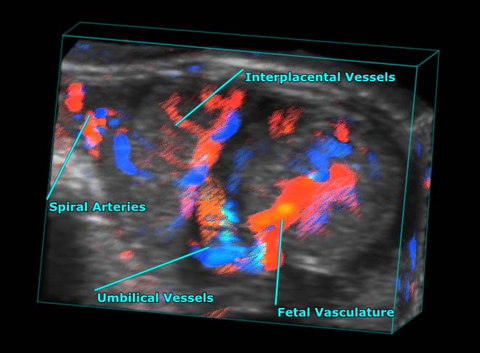
Mid-gestational Mouse Fetus and Placenta
3D color Doppler rendering of a mid-gestational mouse fetus and placenta, highlighted placental and fetal vasculature.
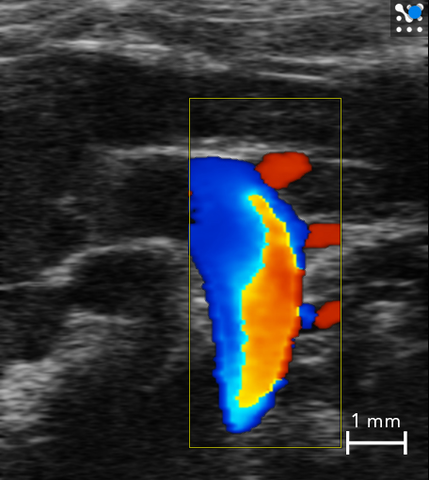
Mouse Aortic Arch
Color Doppler image of the aortic arch in a mouse showing all three branches.