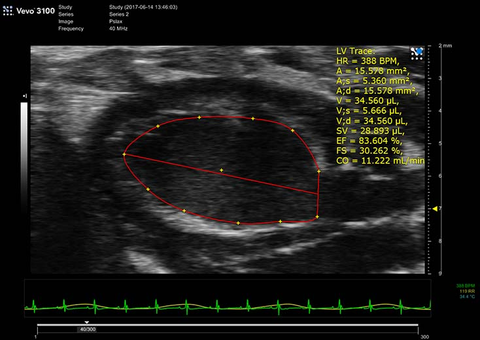
PSLAX LV Trace B-Mode Diastole
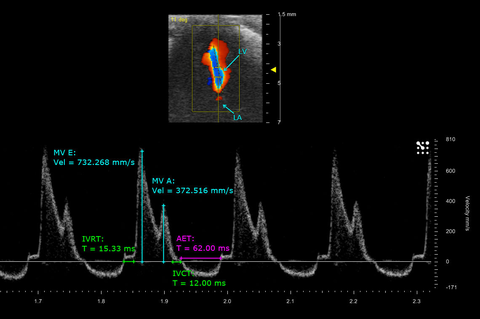
Mitral flow and measurements of a mouse neonate heart
PW Doppler of mitral blood flow in a postnatal day 9 mouse taken from an apical 4 chamber view, with related cardio measurements.

Oxygen saturation in tumor
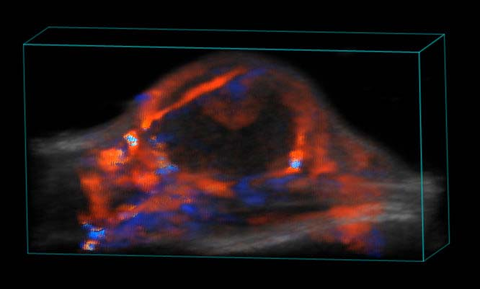
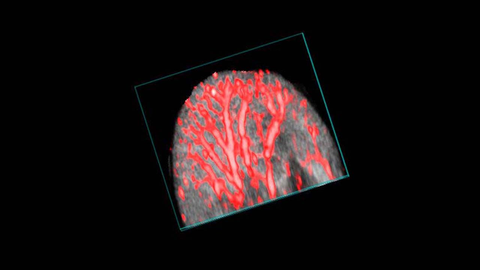
Perfusion in Tumor
3D rendered high-resolution ultrasound (greyscale) and nonlinear contrast (beige) image of a subcutaneous tumor showing perfusion in the tumor tissue.
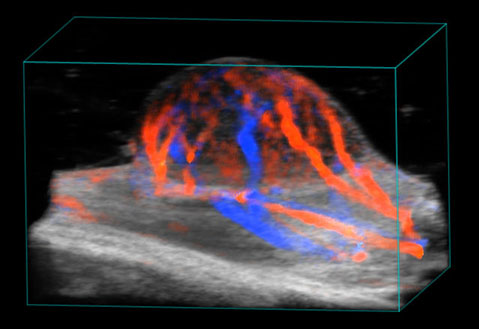
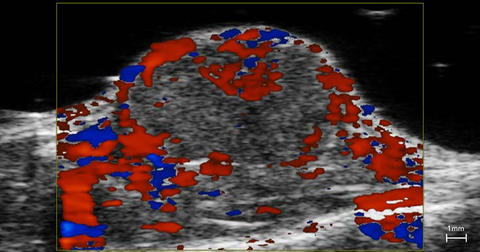
Blood flow in tumor
3D rendered high-resolution ultrasound (greyscale) and color Doppler (orange and blue) image of a subcutaneous tumor showing blood flow.
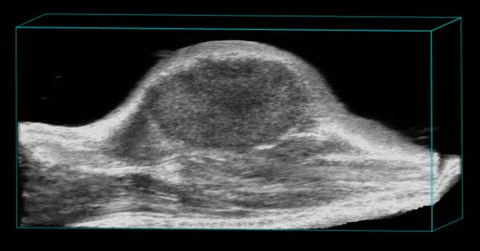
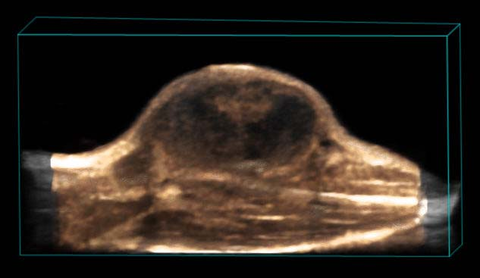
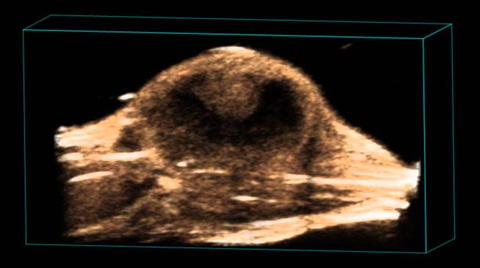
Subcutaneous tumor
3D rendered high-resolution ultrasound image of a subcutaneous tumor.
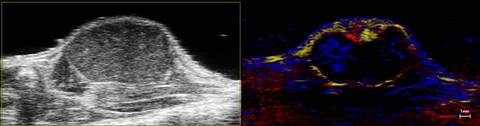
Nanoparticle distribution in tumor
High-resolution ultrasound (left) and spectrally unmixed photoacoustic (right) image of a subcutaneous tumor showing nanoparticle distribution (yellow) as well as oxygenated (red) and deoxygenated (blue) hemoglobin signal.
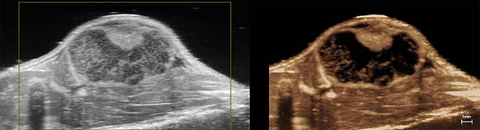
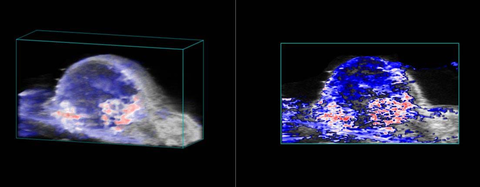
Perfusion in Tumor
High-resolution ultrasound (left) and nonlinear contrast (right) image of a subcutaneous tumor showing perfusion in the tumor tissue.
Blood flow in tumor
Perfusion in Tumor
3D rendered high-resolution nonlinear contrast image of a subcutaneous tumor showing perfusion in the tumor tissue.
Blood flow in tumor
3D rendered high-resolution ultrasound (greyscale) and color Doppler (orange and blue) image of a subcutaneous tumor showing blood flow.
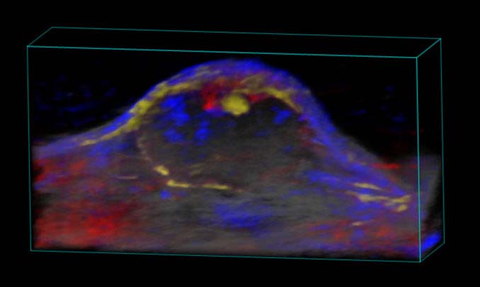
Nanoparticle distribution in tumor
3D rendered high-resolution ultrasound (greyscale) and spectrally unmixed photoacoustic (red, blue and gold) image of a subcutaneous tumor showing nanoparticle distribution (yellow) as well as oxygenated (red) and deoxygenated (blue) hemoglobin signal.
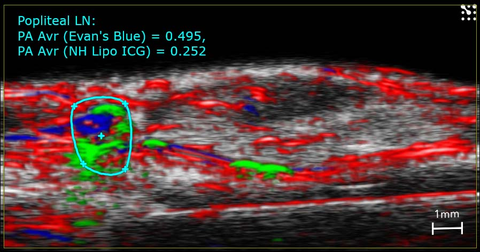
Imaging of lymphatics in the mouse.
High-resolution ultrasound (greyscale) and photoacoustic (red, blue and green) image of the mouse hindlimb showing Evan's Blue (blue) and ICG (green) dye in the lymphatic vessels and the popliteal lymph node.
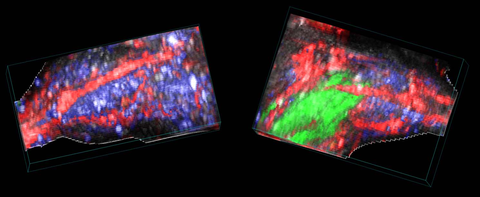
Stem cells in the mouse hindlimb
3D rendered spectrally unmixed photoacoustic image of a stem-cell injected, ischemic (right) and control (left) mouse hindlimb. Oxyhemoglobin (red), deoxyhemoglobin (blue) and dye-labelled stem cells (green) are shown.
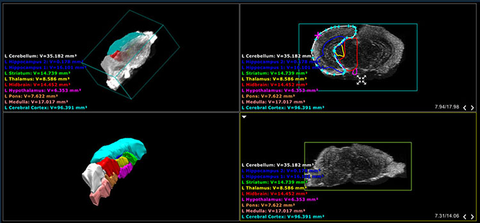
Screenshot of mouse brain atlas
Screenshot of the Vevo LAB software displaying several different views of the CD-1 mouse brain atlas which comes with the Vevo BRAIN stereotactic frame.
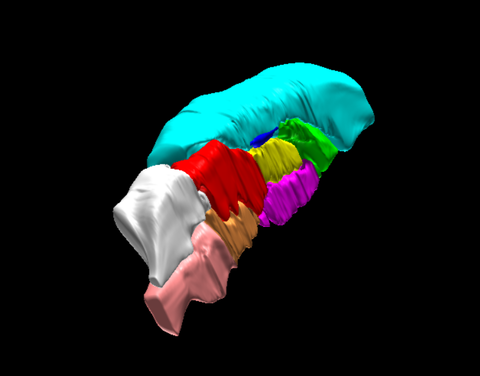
Neuroanatomy of the mouse brain
3D rendered surface view of the mouse brain segmented by anatomical region based on ex vivo high frequency ultrasound images.
Mouse ear vasculature
3D rendered coregistered ultrasound (greyscale) and photoacoustic (red) image of the mouse ear. The photoacoustic signal is derived from the absorption of light by hemoglobin.
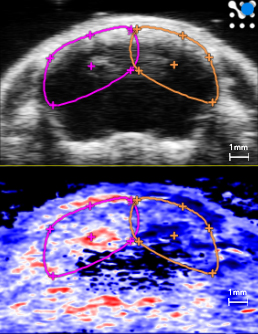
Ischemia/hypoxia stroke model
Plot of oxygen saturation (sO2) over time in the left (pink) and right (orange) cortical and subcortical hemisphere ROIs while restoring breathed oxygen to 100% from 7.5% post ischemia/hypoxia for stroke induction. Ultrasound (top) and photoacoustic (bottom) coronal images in the right panel show a frame of mouse brain post ischemia/hypoxia. The red, white and blue color represents a parametric map of oxygen saturation. The right hemisphere does not fully recover sO2 levels post-reperfusion/normoxia that are shown in the left hemisphere, indicating a cerebral infarct, especially in cortical and subcortical areas.